BACKGROUND
Nutritionally adequate diets are a cornerstone of health and well-being, especially during critical life stages [
1]. Adolescence is a key period of growth and development with increased requirements for micro- and macronutrients [
2]. Older children and adolescents are also becoming more independent from parents, with eating behaviours increasingly shaped by other factors such as personal preferences, peer influence, diverse social settings, and exposure to media and social media [
3]. Poor dietary intakes and suboptimal nutritional behaviours during this time can compromise adolescents’ short- and long-term health through the development of obesity and other risk factors for non-communicable disease later in life such as Type 2 Diabetes [
1]. Within higher-income countries, regional differences in nutritional health may be observed due to differential access to nutrient-dense foods such as fruits and vegetables [
4–
6].
There is evidence that Canadian adolescents are consuming a suboptimal diet. The Canadian Community Health Survey-Nutrition (2015) (CCHS) indicated that most adolescents are not meeting the minimum recommended number of Canada’s Food Guide servings for vegetables and fruit [
7]. Further analysis using the Health Canada Surveillance Tool Tier system (assesses nutritional quality of foods within the Food Guide recommendations) showed poor nutrition quality, with “Other” foods (outside the four food groups) accounting for 21–25% of daily energy intake and majority of these calories coming from high fat and sugary foods [
8,
9]. Diet is linked with excess body weight in Canadian adolescents [
10]; 23.2% of 12–17 year olds were overweight or obese in 2020, with 28.9% in Manitoba [
11].
Adolescents engage in food-related behaviours that contribute to their nutritional risk. These include meal skipping and weight loss dieting, which are associated with lower diet quality [
12]. Some studies suggest that low frequency of family meal consumption is associated with less healthy dietary intake, including higher sugar-sweetened beverage and lower fruit and vegetable consumption [
13]. Adolescents are also higher consumers of fast food compared to other age groups [
14]. Dietary risk factors in adolescents may not, however, be equally distributed through the population, including geographically.
Canada is the second-largest country in the world geographically, yet one of the least densely populated [
15]. The majority of Canada’s residents reside in urban centres; however, within each province or territory between 14% and 64% live in rural settings [
16]. In Manitoba, 40% of the population live in non-metropolitan areas [
17]. Many communities are remote, far from major towns and cities with services such as large grocery stores, creating different benefits and challenges for residents.
Research suggests that health indicators differ across the urban-to-rural gradient, such as child obesity being higher in rural and northern areas [
18]. Rural communities have been shown to experience a health disadvantage [
19]. Nutritional risk factors such as food insecurity may be a contributing factor. Northern communities have higher rates of food insecurity, with those living most remotely in the north (47%) having almost four times the Canadian average (12%) [
20]. Lack of access to healthier foods, such as fruits and vegetables, and high prices due to transportation costs are contributing factors to the rural and northern food environments [
21]. These and other factors related to procurement may also impact the availability of healthy food through school snack and meal programmes [
22].
At the same time, rural communities may lack the plethora of fast-food outlets that increasingly inhabit the urban food scape [
23]. Consequently, it is important to understand the impact of geographic residence on the nutritional health of adolescents in order to formulate appropriate policy responses. Provincial-level nutrition indicators such as those found in the CCHS-Nutrition (2015) can hide important regional differences, as the limited sample size of the CCHS makes sub-provincial analysis of adolescents difficult [
24]. In order to overcome this limitation, the Food and Nutrition Security for Manitoba Youth (FANS) study undertook a nutrition survey of Manitoba grade 9 students with sufficient sample size to describe regional differences and similarities in nutritional health. The purpose of this paper is to describe regional differences and similarities in dietary intake (food and nutrients) and dietary quality.
METHODS
Ethics approval for this study was obtained from the Joint Faculty Research Ethics Board at the University of Manitoba (protocol HS2166 J2018:040), and all experimental methods were performed in accordance with the relevant guidelines and regulations. Detailed methods for the FANS study have been published elsewhere [
25].
Sample
The FANS survey was a self-administered web-based survey of grade 9 students (aged 13–16 years) that collected information on dietary intakes, food behaviours, self-reported health indicators, and sociodemographic variables. Thirty-seven (24 urban, 8 rural, and 5 northern) of 62 eligible English-speaking public schools agreed to participate. Data collection took place from October 2018 to May 2019. Overall, 1571 students completed the survey once.
Regional classification
Participating school divisions and schools were classified into northern, rural, and urban regions of the province. Classification criteria align with geographical boundaries of Manitoba Regional Health Authorities: School divisions within the Winnipeg Health Regional are urban, school divisions in the Northern Health Region are classified as northern (more remote and in the northern part of the province), and remaining school divisions are considered rural [
26].
Measures
Dietary intakes were collected using the Waterloo Eating Behaviour Questionnaire (WEB-Q). WEB-Q has been validated as a reliable self-administered tool for measuring the food and nutrient intake of adolescents using a 24-hour dietary recall [
27]. The survey was administered in schools and overseen by a research coordinator. Dietary intake was assessed through a 24-hour recall module that collected data separately for meals and snacks. Students chose foods and beverages they consumed from a list of approximately 800 food items that were included in the database. Prompt screens with photographic images and associated text assisted students with choosing foods, beverages, and respective portion sizes.
Nutrient intakes were assessed using the 2010 Canadian Nutrient File [
28] and Food Processor (version 8.0, ESHA Research, Salem, OR, 2002) and compared with Dietary Reference Intakes (DRIs) [
29]. Adequate intake was used for dietary fibre. Excess sodium intakes were assessed based on tolerable upper intake levels. Food groups and servings were based on Eating Well with Canada’s Food Guide (2007) (EWCFG) [
30]. “Other” food servings (those not part of the four EWCFG food groups) were determined from serving sizes based on the Canadian Nutrient File [
28,
31].
Diet quality was assessed using a modified Healthy Eating Index-Canada (HEI-C) adapted from Statistics Canada [
32]. HEI-C is based on recommended intakes from the dietary components of EWCFG and DRI. Two additional components were added to align with 2019 Canada’s Food Guide recommendations: “low fat vitamin-D fortified milk and dairy-free beverage alternatives” and “seafood and plant based proteins” [
33]. Possible HEI-C scores ranged from 0 to 100, and participant diets were categorized as poor (< 50), needs improvement (50–80), or good (> 50) [
34].
Data analysis
Diet and survey records were manually checked for quality during the data collection period. Final line-level data were imported into SPSS software and verified for missing and biologically implausible values. Students’ dietary intake data were excluded from analyses if they consumed less than 200 kcal/day or exceeded 6000 kcal/day (n = 35), which resulted in a final analytical sample of 1536.
Study data were analyzed using SAS (version 9.4, SAS Institute Inc., Cary, North Carolina, USA, 2013) (variable derivation) and SPSS (version 27, IBM Corp., Armonk, NY, USA, 2020) (tables and statistical outputs) statistical software packages. Chi-squared goodness of fit was used to compare sample data with existing student population data in the province of Manitoba. Mean and median nutrient and food group intakes were calculated with corresponding measures of variability. Chi-squared tests were performed to compare intakes for nutrients and food groups of northern, rural, and urban region participants, and Cramer’s V was used as a measure of effect size. Chi-squared test was performed to determine significant differences in percentage not meeting recommendations. Data were checked for normality using the Shapiro–Wilk test. Where assumptions of normality were violated, Kruskal Wallis H non-parametric test and post-hoc Mann–Whitney U-test for pair-wise comparisons were used. Fisher–Freeman–Halton Exact test was performed with HEI classification categories due to low expected cell counts. Statistical significance was accepted at p ≤ 0.05. All analyses were undertaken using unweighted sample data.
RESULTS
Of the 1587 participants, 8%, 14%, and 78% were from northern, rural, and urban regions, respectively (
Table 1). Just over half of respondents from northern and urban regions were female. A higher percentage of females participated from the rural region. Participant ages ranged from 13 to 16 years with the majority in northern (90.3%), rural (98.2%), and urban (96.4%) being 14 and 15 years old. The student sample was representative of the total sample frame (Manitoba School Division) for sex in the northern (X
2goodness of fit = 1.73, p = 0.19) and urban (X
2goodness of fit = 3.00, p = 0.08) regions, but not in the rural (X
2goodness of fit = 15.02,
p < 0.001) region.
Median energy intake was similar in the three regions (
Table 2). Macronutrient and micronutrient intakes were generally similar by geographical region with some exceptions. While carbohydrate consumption did not vary significantly, median sugar, sodium, and saturated fat intake were each significantly higher in rural and northern regions. Vitamin C, folate, and calcium were also significantly higher in the northern region.
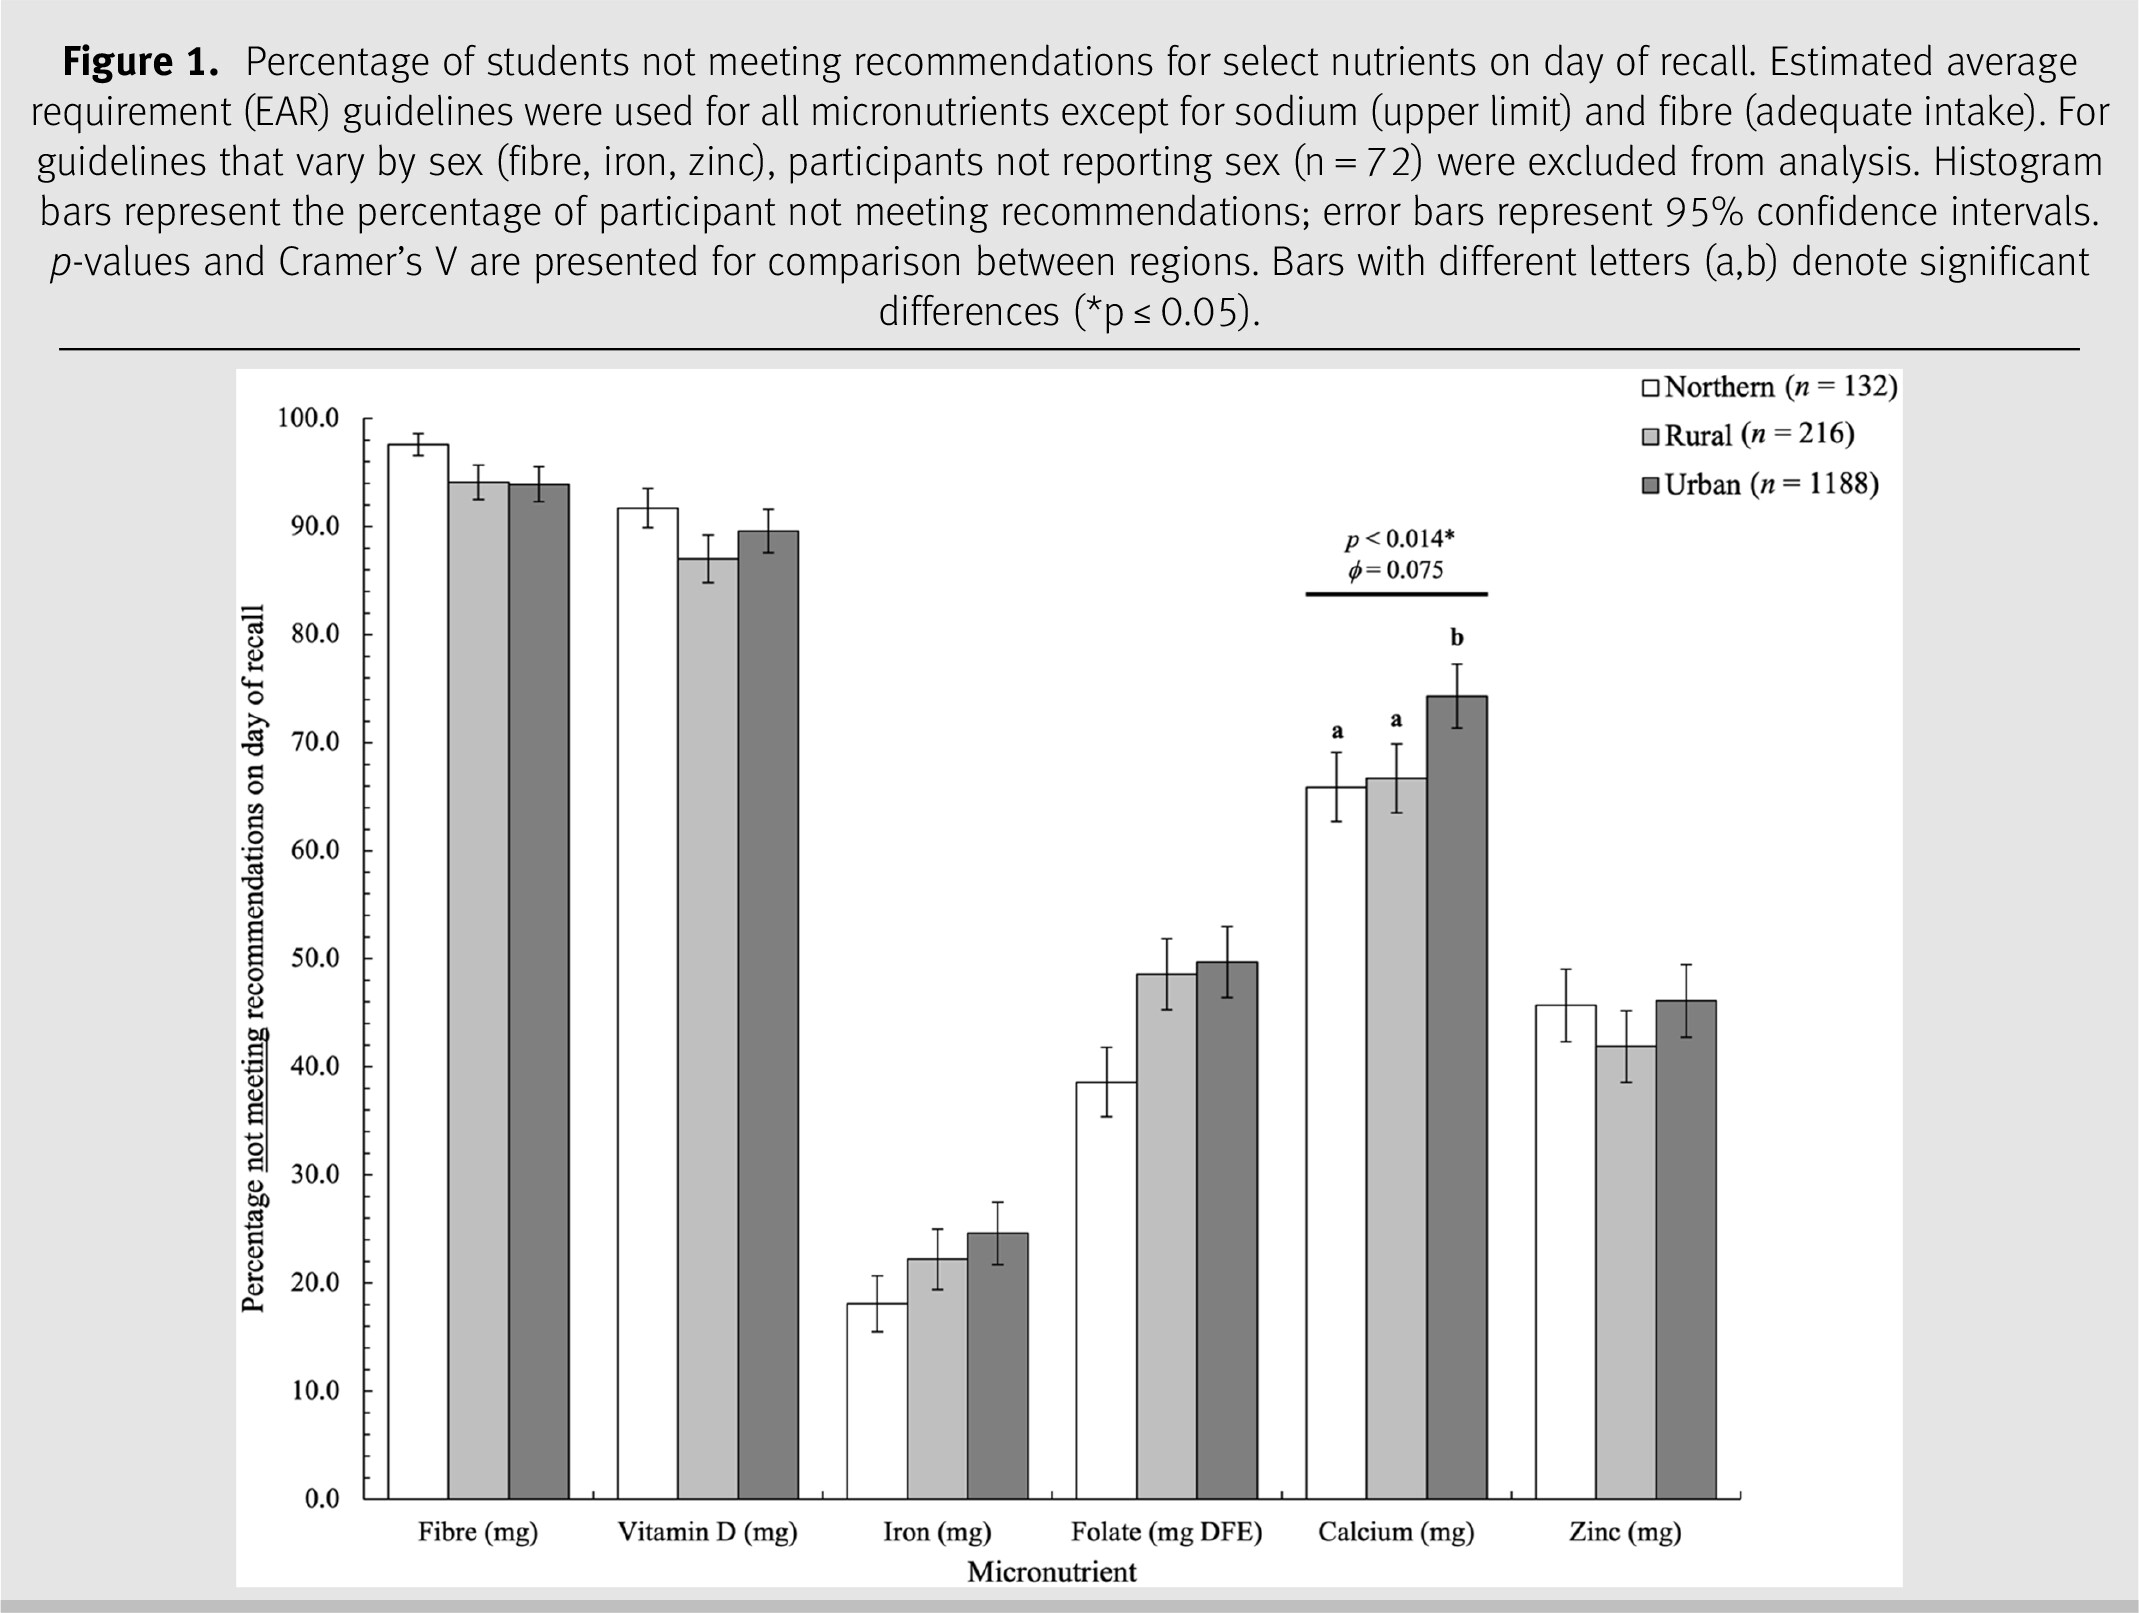
Figure 1 shows that across regions the majority of adolescents did not meet requirements for several nutrients on the day of their dietary recall. Fibre, vitamin D, iron, folate, and zinc did not differ by region; however, significantly more urban students did not meet calcium recommendations compared to urban and rural.
More than 85% of participants did not meet requirements for fibre or vitamin D. Half of respondents did not meet requirements for vitamin A or calcium, and one-quarter did not meet requirements for vitamin C or zinc, in all regions. Energy and sodium intake exceeded recommendations for all regions.
Food groups and ‘Other’ foods are compared by region in
Table 3. Across the three regions, the majority of participants were not meeting requirements for most food groups. The median intake of grain products was lower in the north compared to the urban region, and a higher proportion of northern compared to urban participants were not consuming the recommended servings (55% vs. 41%). The median intake of milk and alternatives was lower in urban compared to rural, though the percentage not meeting recommendations did not differ significantly. Participants in northern and rural areas consumed significantly more servings of ‘Other’ foods (4.0 and 3.5 servings, respectively) than urban participants (3.0 servings).
Diet quality varied significantly by region, as shown in
Table 4. Significantly more northern adolescents had “poor” HEI-C scores than those in urban or rural regions. Overall, however, only 30 participants (2%) were in the “good” category, with the majority within northern (99.2%), rural (98.5%), and urban (97.8%) regions in the “needs improvement” and “poor” categories.
DISCUSSION
Research on adolescent nutrition is essential to inform appropriate food and nutrition-related programmes and policies that can reduce risk of future poor health outcomes and enhance well-being. This is one of the first studies in Canada with sufficient sample size to generate sub-provincial (urban, rural, northern) analyses of adolescent dietary patterns. Although not statistically representative, results point to challenges with adolescent nutritional health in Manitoba that, left unaddressed, will lead to significant human and financial health burdens down the road.
As described, almost no students were classified as having a “good” diet, while significantly more northern students were in the “poor” diet category than in rural or urban regions. Northern students had fewer servings of grain products but significantly more servings of Other foods (e.g., sweets, salty snacks, sugar-sweetened beverages) than urban counterparts. This was reflected in regional variations for sugar, sodium, and saturated fat intake, which were higher in rural and northern students. Urban students consumed slightly fewer servings of milk and alternatives, which was reflected in lower calcium intakes; they also had slightly lower intakes of vitamin C and folate. While regional differences were not found for energy, macronutrients, other micronutrients, vegetables and fruit, or the percentage not meeting milk and alternatives, the intakes of food group recommendations and several key nutrients were low for many students in all regions. Low intake of fruits and vegetables, and milk and alternatives, negatively impacts youth nutrition profiles through inadequate consumption of fibre, folate, vitamin D, and calcium, as shown in this study. This can increase the risk of chronic illness in later life. These results are not surprising, as vegetable and fruit intake is low in all population groups in Canada and milk and alternative consumption has been decreasing in Canada [
7,
35]. While vitamin D can be synthesized from sun exposure, the cold Canadian climate and reduced sunlight hours in winter can reduce vitamin D synthesis [
36] and food sources are few. While milk in Canada is fortified with vitamin D, consumption data suggest that additional fortification strategies should be investigated to improve vitamin D status in all age and sex groups [
37].
While there is a paucity of regional dietary data for Canadian adolescents, reports on regional differences in nutrition and health indicators for the overall population show similarities and differences between studies. A 2006 Canadian report showed that fewer rural residents consume five or more servings of vegetable and fruit each day compared with urban residents [
19] while a 2019 Manitoba report showed no significant difference in those having five or more servings per day between urban, rural, and northern residents [
38], as we also observed. Of note is that over 90% of students in all regions did not meet the vegetable and fruit recommendation. This is consistent with other reports that show low fruit and vegetable intakes across populations suggesting population-wide strategies are required to improve consumption [
7,
39].
Higher prevalence of poor nutrition indicators and body mass index in northern and rural areas (reported elsewhere) [
25,
40] may be related to factors such as food security. In particular, northern and some rural Manitoba communities have high rates of food insecurity due to reduced access to healthy foods, and high prices [
4,
41,
42]. Healthier foods may be replaced by Other foods as suggested by the higher number of servings consumed by participants in northern and rural regions. These foods are often “ultra-processed” and high in salt, sugar, and saturated fat, which are typically more shelf-stable and more available than their fresh counterparts [
43]. Northern and remote communities also have much less choice about where food is purchased, with many communities having no store, or only one store controlling the supply [
44]. Subsidizing more nutrient-dense foods such as healthy grains, milk products, and fruits and vegetables could help improve access to healthier foods in these communities.
Residents of northern Manitoba are further disadvantaged from relatively high food prices by having significantly lower incomes. According to the 2016 Census, the mean household income in northern Manitoba was about $10,000 lower than the provincial average [
45].
This study has several limitations. Study results may not be representative of all grade 9 adolescents in Manitoba, as there may be selection bias. In particular, the study did not include schools in First Nation communities, where incomes are very low compared to other communities [
46], and food costs and insecurity are much higher than other communities in Manitoba [
47]. Therefore, results for the north and some rural regions may not be reflective of the true situation. There was, however, participation by schools from all regions of the province, and the results are consistent with trends observed in other Canadian regions [
31]. Finally, only one dietary recall was collected per student, and self-reported dietary intakes tend to under-estimate intake, do not reflect within-person variability, and may over/under-report foods due to social desirability (i.e. reporting consumption of more “healthy foods” and fewer “unhealthy foods”). Participants were also not asked about vitamin and mineral supplement intakes.
Further research should include ongoing, regionally representative surveillance of adolescent nutrition risk factors throughout the province, including biological markers. It should also assess adherence to the 2019 Canada’s Food Guide [
33]. Research should also examine “on the ground” experiences in regional communities to determine local experiences and potential responses to the issues identified in this research.
RELEVANCE TO PRACTICE
This study examined the regional similarities and differences in nutrient and food group intakes in Manitoba adolescents. While most of the participants in this study are at nutritional risk, there appear to be additional vulnerabilities in rural and northern communities. Understanding these regional nuances is critically important for developing appropriate and effective programme and policy responses. Failure to do so will accelerate progress towards already too-high rates of nutrition-related chronic illness such as Type 2 Diabetes. The FANS study’s collaboration with education and community-based partners will strengthen these responses, which are urgently warranted. The situation may have worsened since this study due to COVID and resultant impacts on food supply chain issues and inflation.
The high number of students with poor diet quality throughout Manitoba, with a higher burden in northern and rural communities with respect to some indicators, demonstrate that provincial and regional responses are required to improve youth diets and reduce risk for obesity and future chronic illness. Dietitians can play a key role in advocating for regular monitoring of child nutritional health as a means to measure progress and effectiveness of interventions. These can include increasing availability of and subsidies for healthy foods in northern and remote communities; establishing universal school meal programmes that meet healthy eating guidelines and local preferences; and implementing universal school-based food literacy programmes.