INTRODUCTION
The price and affordability of food are key determinants of diet quality and nutrition-related health [
1]. Globally, food cost is monitored through “food baskets” (also called “market baskets”), which are made up of foods that represent a healthy diet and reflect the typical purchasing patterns of the population [
1]. Food baskets are more accurate reflections of the cost of diets compared with other food costing tools such as the consumer price index (CPI) [
2]. CPIs are limited in their focus on individual foods rather than overall eating patterns and provision of data solely for urban centres [
2,
3]. As such, CPIs cannot be used to interpret food affordability in the context of costs of living (e.g., housing costs).
In Canada, there is no standardized food costing protocol, though most provinces adapt the National Nutritious Food Basket (NNFB) [
4]. The NNFB was created by Agriculture and Agri-Food Canada in 1974 to calculate the cost of a nutritious diet for different age and sex groups [
5]. It informs the food component of the Market Basket Measure used to determine the official federal poverty line [
6]. Provincial stakeholders use local NNFBs to monitor food affordability in their regions and inform social and health policy and programming [
6].
The NNFB was adapted by Ontario into the Ontario Nutritious Food Basket (ONFB) in 1998 and later updated in 2008 following the release of the 2007 Canada’s Food Guide [
5]. With the advent of the new food guide in 2019, Health Canada published updates to the NNFB [
7], which were integrated in the ONFB by the Ontario Dietitians in Public Health – Monitoring Food Affordability in Ontario subgroup in 2020. The updates include changes to food item descriptions and purchase sizes to better align with product availability in Ontario. Despite the federal updates to the NNFB, as of 2018, the Ontario Public Health Standards no longer specify the protocol that must be followed despite stipulating local “boards of health are required to monitor food affordability at a local level” [
4,
5]. For consistent and standard measurement, the ONFB remains a widely adopted tool in public health units (PHUs) in Ontario used to fulfill local food costing requirements [
4,
5].
Pricing information for the ONFB has conventionally been collected through annual in-store audits by each PHU [
5]. This traditional approach to food pricing is common in Canada and other countries, though one pilot study exploring online price collection has been conducted in Ireland [
8]. With the high labour associated with in-person data collection and the emergence of the COVID-19 pandemic, practitioners and policy-makers are incentivized to consider new methods.
The aim of this study was to assess the reliability and validity of a new online approach to collecting food prices from major grocery chains in Ontario. We aimed to determine the consistency in food prices of ONFB items collected online within and between raters (intra- and inter-rater reliability, respectively) and between online and in-store methods (validity). Our hypotheses were
1.
Food prices collected twice by the same rater on the same day from the same store will not differ using the online process.
2.
Food prices collected by different raters on the same day from the same store will not differ using the online process.
3.
Food prices collected on the same day from the same store by one rater using the online protocol will not differ from another rater using the in-store process.
4.
The cost of the ONFB for a family of four will not differ depending on whether it was collected by the online or in-store process.
Our secondary objectives were to assess reliability and validity of the ONFB online process by region and food category.
METHODS
This study consisted of two cross-sectional components assessing the reliability and validity of the online ONFB tool. Both components relied on publicly available online food and beverage prices and were collected following the updated ONFB tool. Eligible stores were limited to large grocery chains with consumer-facing online platforms. Grocery stores with small market share and those without online platforms were excluded from the sample. This study is a continuous quality improvement project using publicly available data that do not involve direct interaction between researchers and individuals and is therefore exempt from ethics approval. However, approval was obtained from store owners or managers to collect prices in-store.
Reliability assessment
Food prices were collected online during a 1-week period in February 2021 in 12 grocery stores from four major grocery retailer chains, including premium and value banners. Store name and information are confidential as per our agreement with stores when we requested permission to access stores for this project. Stores sampled were required to be near PHUs across four regions in Ontario: Southwestern, Central, Eastern, and Northwestern for logistical reasons. PHUs were selected based on their geographic dispersion and the availability of major online retailers. Store addresses closest to PHU offices were entered on store websites and two raters independently collected food price data from all stores. Through searching and sorting, raters identified the lowest price per kilogram or defined purchase unit for each item in the ONFB. Sale items were priced provided they were not part of multi-price schemes (i.e. discounts for purchasing multiple items). Each rater completed 15 online store audits that allowed for eight intra-rater and ten inter-rater comparisons across 61 food items and seven food categories (see supplemental files
1 for ONFB items and categories).
Intra-rater reliability was measured as the difference in prices recorded by a single rater during two different times (morning and evening) on the same day from the same store. Inter-rater reliability was measured as the difference in prices recorded by the two raters for a single food item on the same day from the same store. The percentage perfect agreement two-way random intra-class correlations (ICCs) of prices between and within raters was calculated for each item in the ONFB across all stores. Since the raters aimed to record the item with the lowest price per kilogram, particular brands/products were not specified in the costing tool beyond the description and purchase units indicated.
Validity assessment
After minor edits to the online tool and process following reliability assessment (e.g. clarified product types, decision pathway when products are unavailable), a second round of food price data collection was conducted in February 2022. The ONFB was priced in-store and online for 28 grocery stores from four major grocery retailer chains, including premium and value banners, that were purposively selected for diversity in geographic location and population size. Nineteen stores in the South (9 small/medium, 10 large) and 9 stores in the North (7 small/medium, 2 large) were included. Population centres were classified following Statistics Canada population size cut-offs (small: 1,000–29,000; medium: 30,000–99,999; large: 100,000+ persons) and the North/South regional classification followed alPHa categorization [
9,
10].
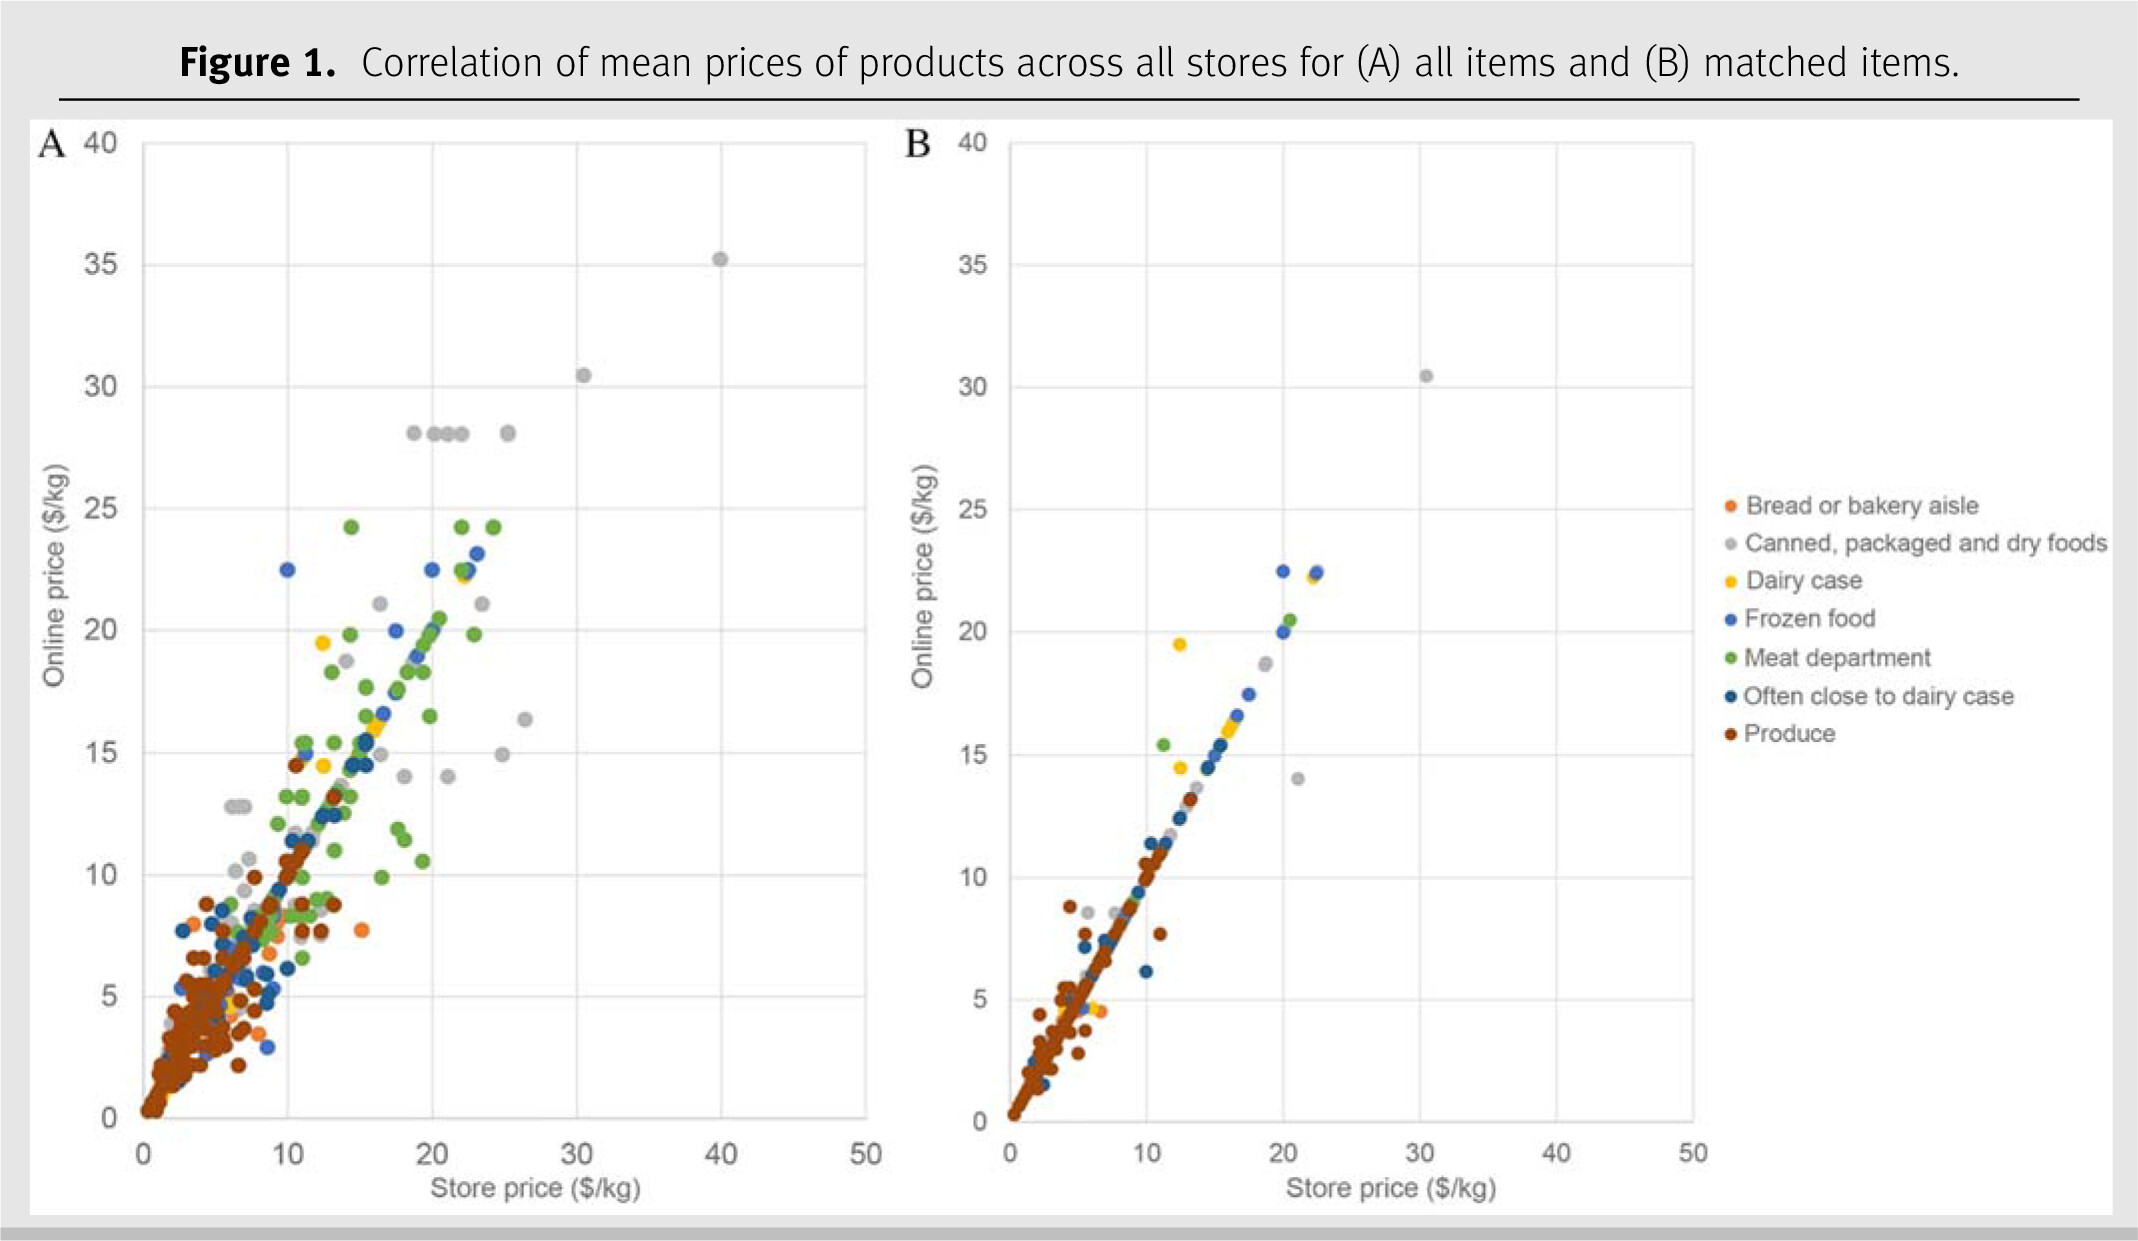
Two raters completed in-store and online food costing for the same store on the same day, recording product name/brand, purchase unit, and price. It was not possible to have the same individual complete costing by both methods for one store due to logistical challenges and capacity. Both in-store and online raters recorded the lowest price per kilogram or defined purchase unit for each item in the ONFB. Raters were encouraged to communicate with their partner to ensure the same products and lowest price possible were recorded by both raters, reducing the likelihood of inter-rater error obscuring the validity of the online method. When discrepancies existed, raters always recorded the cheapest items available by their method. To estimate agreement between online and in-store prices, percent agreement was calculated for all items and matched items (i.e. when raters recorded the exact same product/brand and purchase unit). Percent perfect agreement, paired t-tests, and Pearson’s correlation for all (n = 1708 pairs) and matched items (n = 1134) were calculated.
Since the purpose of the ONFB is to estimate the cost of a healthy food basket for a household, the difference in online and in-store food basket costs was examined as part of the validity assessment. Using a spreadsheet from Statistics Canada that generates the cost of the NNFB for each age and sex group, we calculated the food cost online and in-store for a family of 4 (female age 4–8; male age 14–18; male age 31–50; female age 31–50). The total cost per family per day was multiplied by 1.05 to account for miscellaneous items and then by 4.33 to calculate monthly costs. Usually, a Household Size Adjustment Factor is applied that accounts for economies of scale (lower cost per person to feed a larger family) where the weekly cost of the food basket is adjusted by 0.9–1.20, but the Household Size Adjustment Factor is 0.0 for a family of four so no adjustment was made.
IBM SPSS Statistics for Windows v28.0.1.0 (2021, IBM Corp., Armonk, New York) was used for all analyses with statistical significance level set at α = 0.05.
DISCUSSION
Our study aimed to evaluate an online approach to monitoring food affordability. The study had four main findings. First, intra- and inter-rater reliability was high. Second, most foods were available both online and in-store, allowing for matching of products. Third, prices of items in-store and online were highly correlated, with very small (and thus likely insignificant) price differences across both matched and all products. Last, the monthly cost of the ONFB for a family of four was almost perfectly correlated between in-store and online. Thus, the findings suggest that the online approach is a reliable and valid method for online food pricing of the ONFB in major grocery store chains when used by trained raters (e.g. registered dietitians, nurses, community workers).
Intra- and inter-rater reliability was high across most stores and food categories. As such, the online platforms can be reliably used to produce consistent results regardless of who is using them or at what time of day. Product availability and match were high and did not differ by region or food category. Similar trends were observed in a study examining streamlined (online and telephone) compared with traditional (in-store) food pricing methods, which found mean price and availability agreement to be very high in grocery stores – upwards of 99% of food items sold in grocery stores had the same price online and in-store [
11]. Further, no differences in price were observed by remoteness of location, as was the case in the present study [
11]. This affirms the homogeneity of food prices in large multi-chain stores across Ontario.
The price difference across all food items was on average less than $0.02 lower in-store than online. The greatest price difference observed by food category was $0.51 per purchase unit, which constituted a 0.04% increase online above that recorded in-store. This is in line with previous research conducted by Cavallo [
12] which, to the authors’ knowledge, constitutes the largest online price comparison study to date in Canada. In this study, price data for large multi-chain companies, including Carrefour, Lawson, and Walmart, identified that online and offline prices of grocery and non-grocery items were identical 91% of the time [
12]. Similar to the price differentials observed in the present study, Cavallo et al. observed that online prices were only up to 4% greater than in-store prices. [
12]. These findings corroborate the validity of the online method for food cost monitoring as they underscore the comparability of online and in-store methods.
Finally, although we observed a $16.50 difference in the cost of a monthly food basket for a family of four in Ontario between online and in-store data collection, the two methods were almost perfectly correlated. Given that the total monthly costs for both methods were around $920–940, this translates to only approximately 1.8% increase in cost. When viewed in the context of other costs of living such as housing costs, the $16.50 difference is not likely to be seen as significant. This indicates that when employed in a practice setting, the online approach to food costing is not only feasible and reliable but also results in food cost estimates that are valid when compared against the gold standard of in-store costing. Further, though traditional in-store food costing is considered the gold standard, to the authors’ knowledge, it has not been formally assessed in the Canadian context with regard to its reliability or validity [
13]. As such, it is possible that there is a certain margin or error present, which may be skewing the observed difference.
In traditional food cost monitoring, time and resources must be dedicated for travel to and from the store, as well as for establishing relationships with the retailers, in addition to the time spent actually costing the food. Aside from the food baskets and CPI, another widely used tool is the Nutrition Environment Measures Study retail stores audit instrument (NEMS-S), which measures the quality, availability, and price of foods sold in grocery stores [
14,
15]. The NEMS-S has been validated and is reported to have high inter-rater and test–retest reliability [
14]. However, a key limitation of NEMS-S is the need for personnel to spend long periods of time collecting the data, particularly for travel and walking around on location [
14]. The online approach may thus be time and cost-saving, with the increased efficiency allowing PHUs to more effectively utilize their resources. Regardless of the preferred method, staff and volunteers must be adequately trained to use food costing tools and select the most appropriate product at the lowest price per kilogram or unit. Incorrectly selecting products to price may introduce more error into the cost of a nutritious food basket than any error associated with the collection of food prices online or in-store.
Moreover, there is presently a transition to digital food environments, accelerated by the COVID-19 pandemic [
16]. In the United Kingdom (excluding Northern Ireland), online food sales have doubled between 2020 and 2021 and in Australia one in three people have bought their groceries online since the start of the pandemic [
16]. Consequently, online approaches to food cost monitoring will continue to become increasingly important as digital food environments rapidly evolve.
Strengths and limitations
To the authors’ knowledge, this is the first study to assess the reliability and validity of an online approach to food cost monitoring. Though disparate pilot studies employing online methods have been published [
8], to date, no online approaches have been compared against the gold standard of in-person food costing. The results of this study provide meaningful insight into the modernization of food cost monitoring efforts in Ontario, Canada, and worldwide.
Some limitations must be noted. First, due to reliance on consumer-facing web platforms, this approach is limited to large multi-chain retailers with an online presence. As such, smaller local retailers, particularly independently owned ethnic grocery stores, continue to require in-store costing provided they meet the Ontario Dietitians in Public Health – Monitoring Food Affordability in Ontario subgroup criteria. This may pose concerns in more remote communities, which may be primarily served by independently owned local retailers. In effect, though there is homogeneity of large multi-chain stores, there may be cost difference regionally when in-store and online costing are integrated in a hybrid process. Nonetheless, due to larger national/provincial chains being the focus of the analysis, generalizability of findings is improved. Second, the ONFB excludes more expensive foods, including some higher priced convenience foods and pre-prepared items. As such, the calculated cost is likely lower than what consumers actually spend [
17]. Further, the basket may not be representative of the typical diet. Finally, our data collection occurred during winter months, where most food costing activities in Canada usually take place in the spring or fall. Although food prices are affected by seasons, we do not have any reason to believe that the reliability and validity of online pricing would be affected by seasonality. We expect that any differences between in-store and online prices that would make the tool more or less valid would be more likely to be random than systematic errors due to seasons. Thus, we believe our findings on reliability and validity to be reasonably generalizable to the full year. The reliability and validity of online food pricing methods our results support may be time-bound due to its collection during the COVD-19 pandemic. Reliability and validity of tools are only as static as the contexts in which they are used. The design or function of online food purchasing platforms is likely to evolve due to the multiple micro and macro factors impacting food prices and consumer behaviour in Canada [
18], and thus online food pricing methods should be reviewed in the future and adapted as necessary.
RELEVANCE TO PRACTICE
Prompted by the COVID-19 pandemic and the new Canada’s Food Guide publication, the need for a novel approach to food costing arose [
19]. The present study fulfills a practice-based need to modernize food affordability monitoring and establishes online food costing as a reliable and valid approach when compared with the gold standard of in-store data collection. Online food costing facilitates safe and efficient monitoring, allowing data collection to be streamlined across the province. Nonetheless, given the multitude of research on price disparities between Northern and Southern regions in Canada [
20], online pricing should continue to be used in combination with in-store audits, especially in more Northern and rural communities.
The availability of food prices online is increasing, facilitating the evolution of public health nutrition data collection methodology as it has in other disciplines like economics [
11]. This is key to effectively and efficiently monitoring food affordability as required by provincial standards and allows PHUs to be better able to address community needs [
5]. Accurate food cost data equip public health practitioners with the ability to better estimate food affordability. In turn, food affordability data can be used to advocate for food security policies/programs (e.g. guaranteed income supplement) to alleviate household food insecurity. Ultimately, this new approach pioneers the online monitoring food affordability process, paving the way for the modernization of food costing across Canada and beyond.